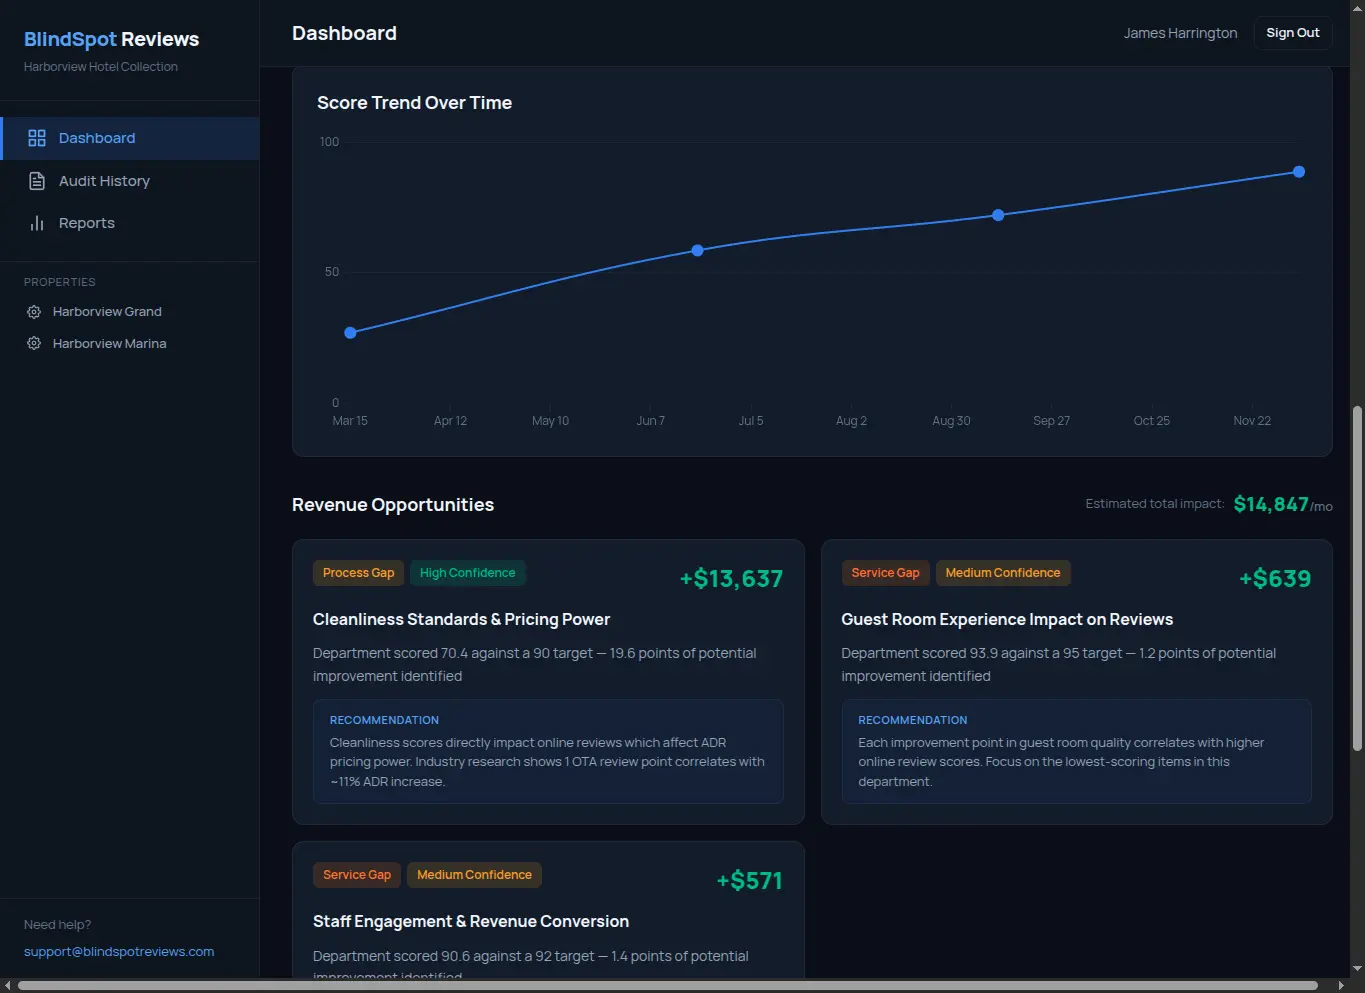
Every gap has a dollar value.
Our revenue impact analysis connects evaluation scores directly to your bottom line. Missed upsells, service gaps, and process failures are quantified with monthly dollar estimates.
Hundreds of data points. Weighted scoring categories tailored to your business type. One composite score you can track quarter over quarter.
Every evaluation runs through the same weighted framework — tailored to your business type. Hundreds of data points, scored across weighted categories, producing a single composite performance number you can track over time.
The weights are configurable per property. A hotel with a restaurant gets heavier F&B weighting. A retail store with fitting rooms gets more weight on staff interaction. The algorithm adapts — the rigor doesn't.
Every evaluation follows the same pipeline. No judgment calls, no subjective opinions — just structured data in, actionable scores out.
Evaluator documents every touchpoint during a real visit — every interaction, timestamp, and observation. Hotels, restaurants, and retail each have their own checklist.
Each data point is scored against our standardized rubric. No room for interpretation — the criteria are binary or scale-based.
Scores are weighted by category based on your business type and configuration. A restaurant weights food quality highest. A hotel weights room quality. The algorithm adapts.
Category scores aggregate into a single composite performance number — your BlindSpot Score. Comparable across evaluations and quarters.
Your score is contextualized against industry standards and previous evaluations to identify trajectory and relative positioning.
The BlindSpot Score isn't just a number — it maps directly to guest experience quality and revenue performance. Here's how to read it.
Operating at or above major brand standards. Minor refinements only.
Solid performance with specific areas for improvement. Competitive positioning.
Meets baseline expectations but leaving revenue on the table. Clear action items.
Noticeable gaps in guest experience. Likely reflected in online reviews.
Significant operational issues. Immediate intervention recommended.
Same framework every time. Your Q1 score and Q4 score are directly comparable. No evaluator bias, no shifting criteria.
Category weights adjust to your business type. A fine dining restaurant gets different weighting than a boutique hotel or a retail flagship.
Every gap identified includes a revenue impact estimate. You know what each issue is costing you per month.
Our revenue impact analysis connects evaluation scores directly to your bottom line. Missed upsells, service gaps, and process failures are quantified with monthly dollar estimates.