Brands Benchmarked

Our evaluation framework is built against the service standards of the world's leading hospitality brands. When we score your property, this is the bar we're measuring against.

Marriott
Hilton
Four Seasons
Nordstrom
Ritz-Carlton
Apple Retail
Hyatt
IHG
Accor
Best Western

Evaluation Results

Anonymized results from real evaluations. Property details redacted to maintain client confidentiality.

Boutique Hotel 42 rooms · Coastal property
Before 62
After 81
  • Check-in score improved from 54 to 88 after front desk retraining
  • Revenue opportunity of $3,200/month identified through upsell gaps
  • Housekeeping response time reduced from 45 min to 18 min average
Independent Restaurant 72 seats · Downtown district
Before 55
After 78
  • Server upselling score increased 34 points after training on appetizer and wine suggestions
  • Revenue opportunity of $4,100/month identified through missed dessert and beverage upsells
  • Food delivery timing improved from 24 min average to 16 min after kitchen workflow changes
Retail Flagship 3,200 sq ft · Shopping district
Before 61
After 82
  • Staff greeting rate improved from 38% to 91% of customers after engagement training
  • Checkout upsell conversion increased from 4% to 18% with new associate scripts
  • Email/loyalty capture rate went from 12% to 47% within one quarter
Independent Hotel 87 rooms · Urban market
Before 58
After 74
  • F&B score increased 22 points after menu and service restructuring
  • Guest name usage at check-in went from 12% to 89% of interactions
  • Online review average improved from 3.8 to 4.3 within two quarters
Fast Casual Restaurant 48 seats · Suburban area
Launch Score 76
  • Pre-opening audit identified 18 service gaps before first customers
  • Staff readiness score of 76 achieved before launch day
  • Kitchen efficiency baseline established for ongoing quarterly tracking
Boutique Retail 1,800 sq ft · Tourist area
Before 54
After 73
  • Fitting room assistance score improved from 41 to 85 with staffing changes
  • Average transaction value increased 22% through cross-sell training
  • Repeat customer rate grew from 18% to 31% after loyalty program improvements

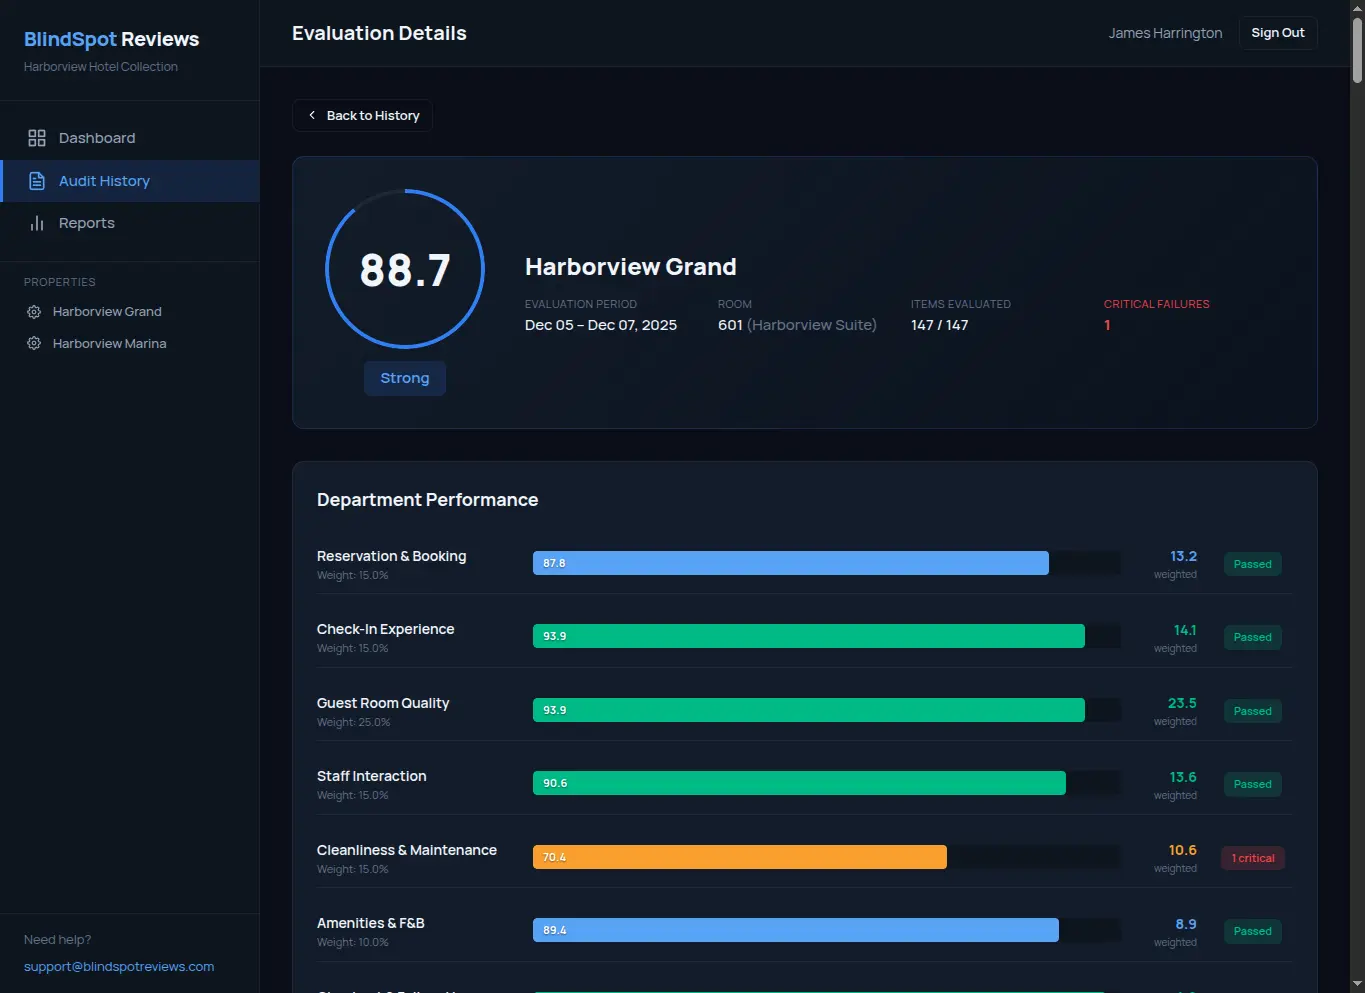
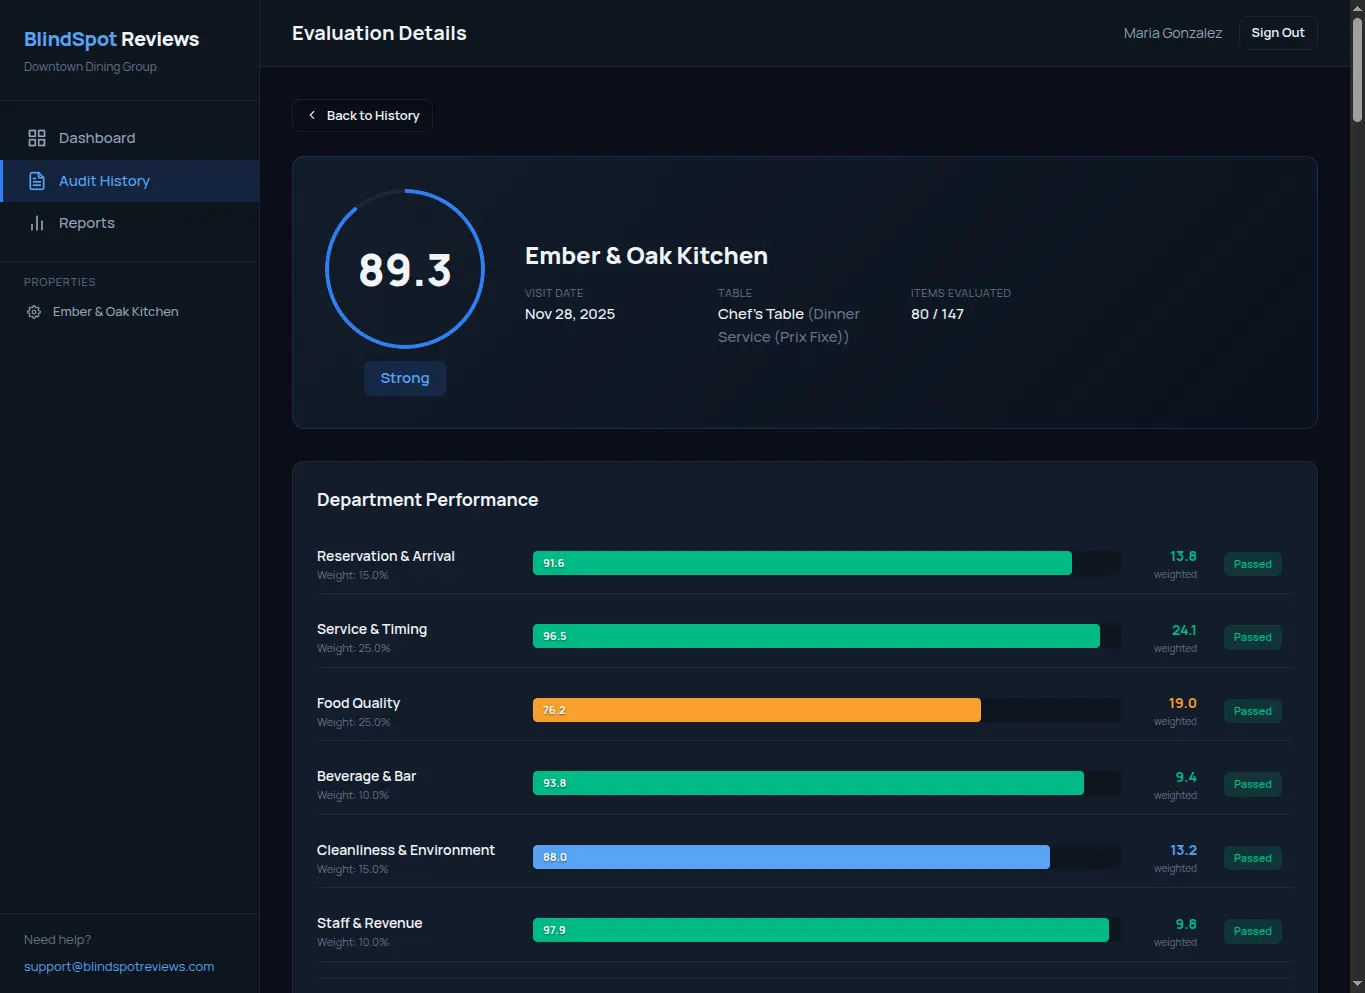
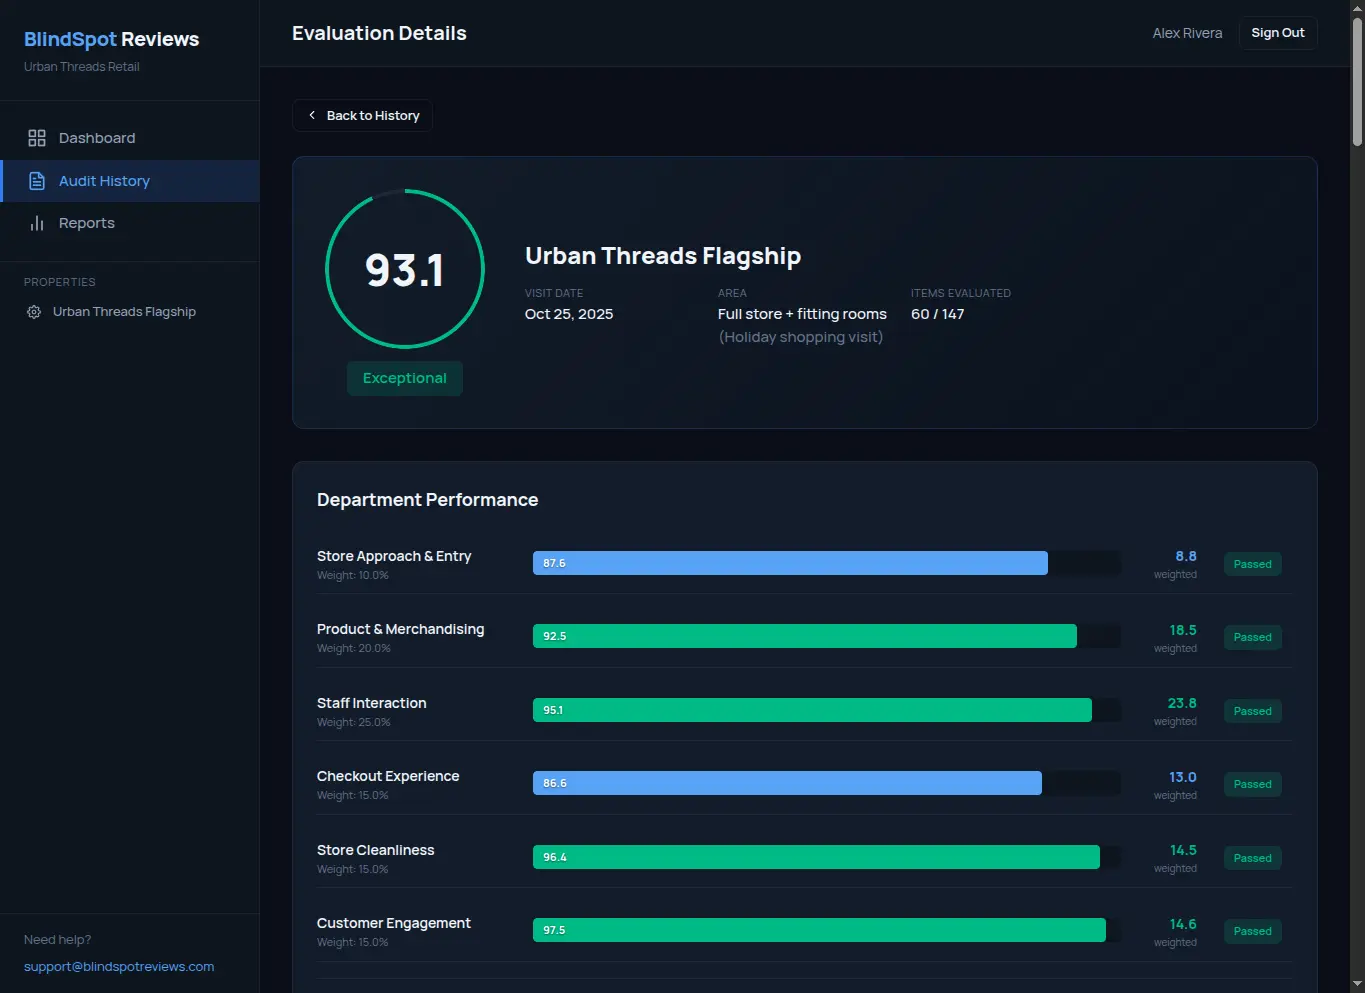
Your private dashboard.

Every evaluation populates your dashboard with scored, trackable data. Department breakdowns, revenue opportunities, trend charts — all updated in real time.

BlindSpot Reviews hotel audit detail showing overall score, department performance grid, and evaluation breakdown
BlindSpot Reviews restaurant audit detail showing food quality, service timing, and department scores
BlindSpot Reviews retail audit detail showing store approach, staff interaction, and checkout scores

Want to see what your business scores?

Book a Demo View Pricing