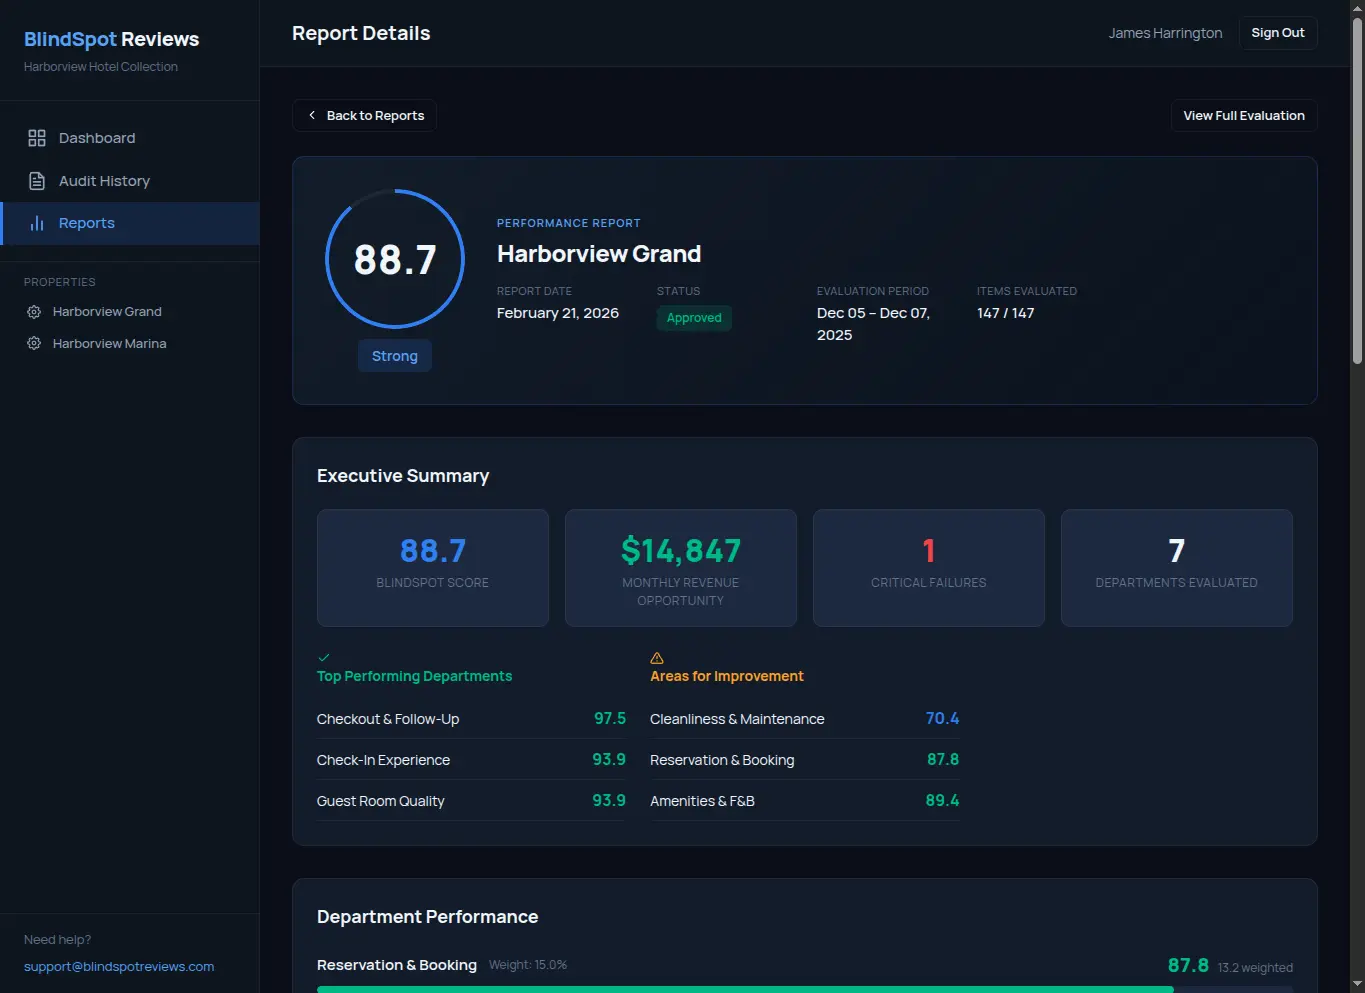
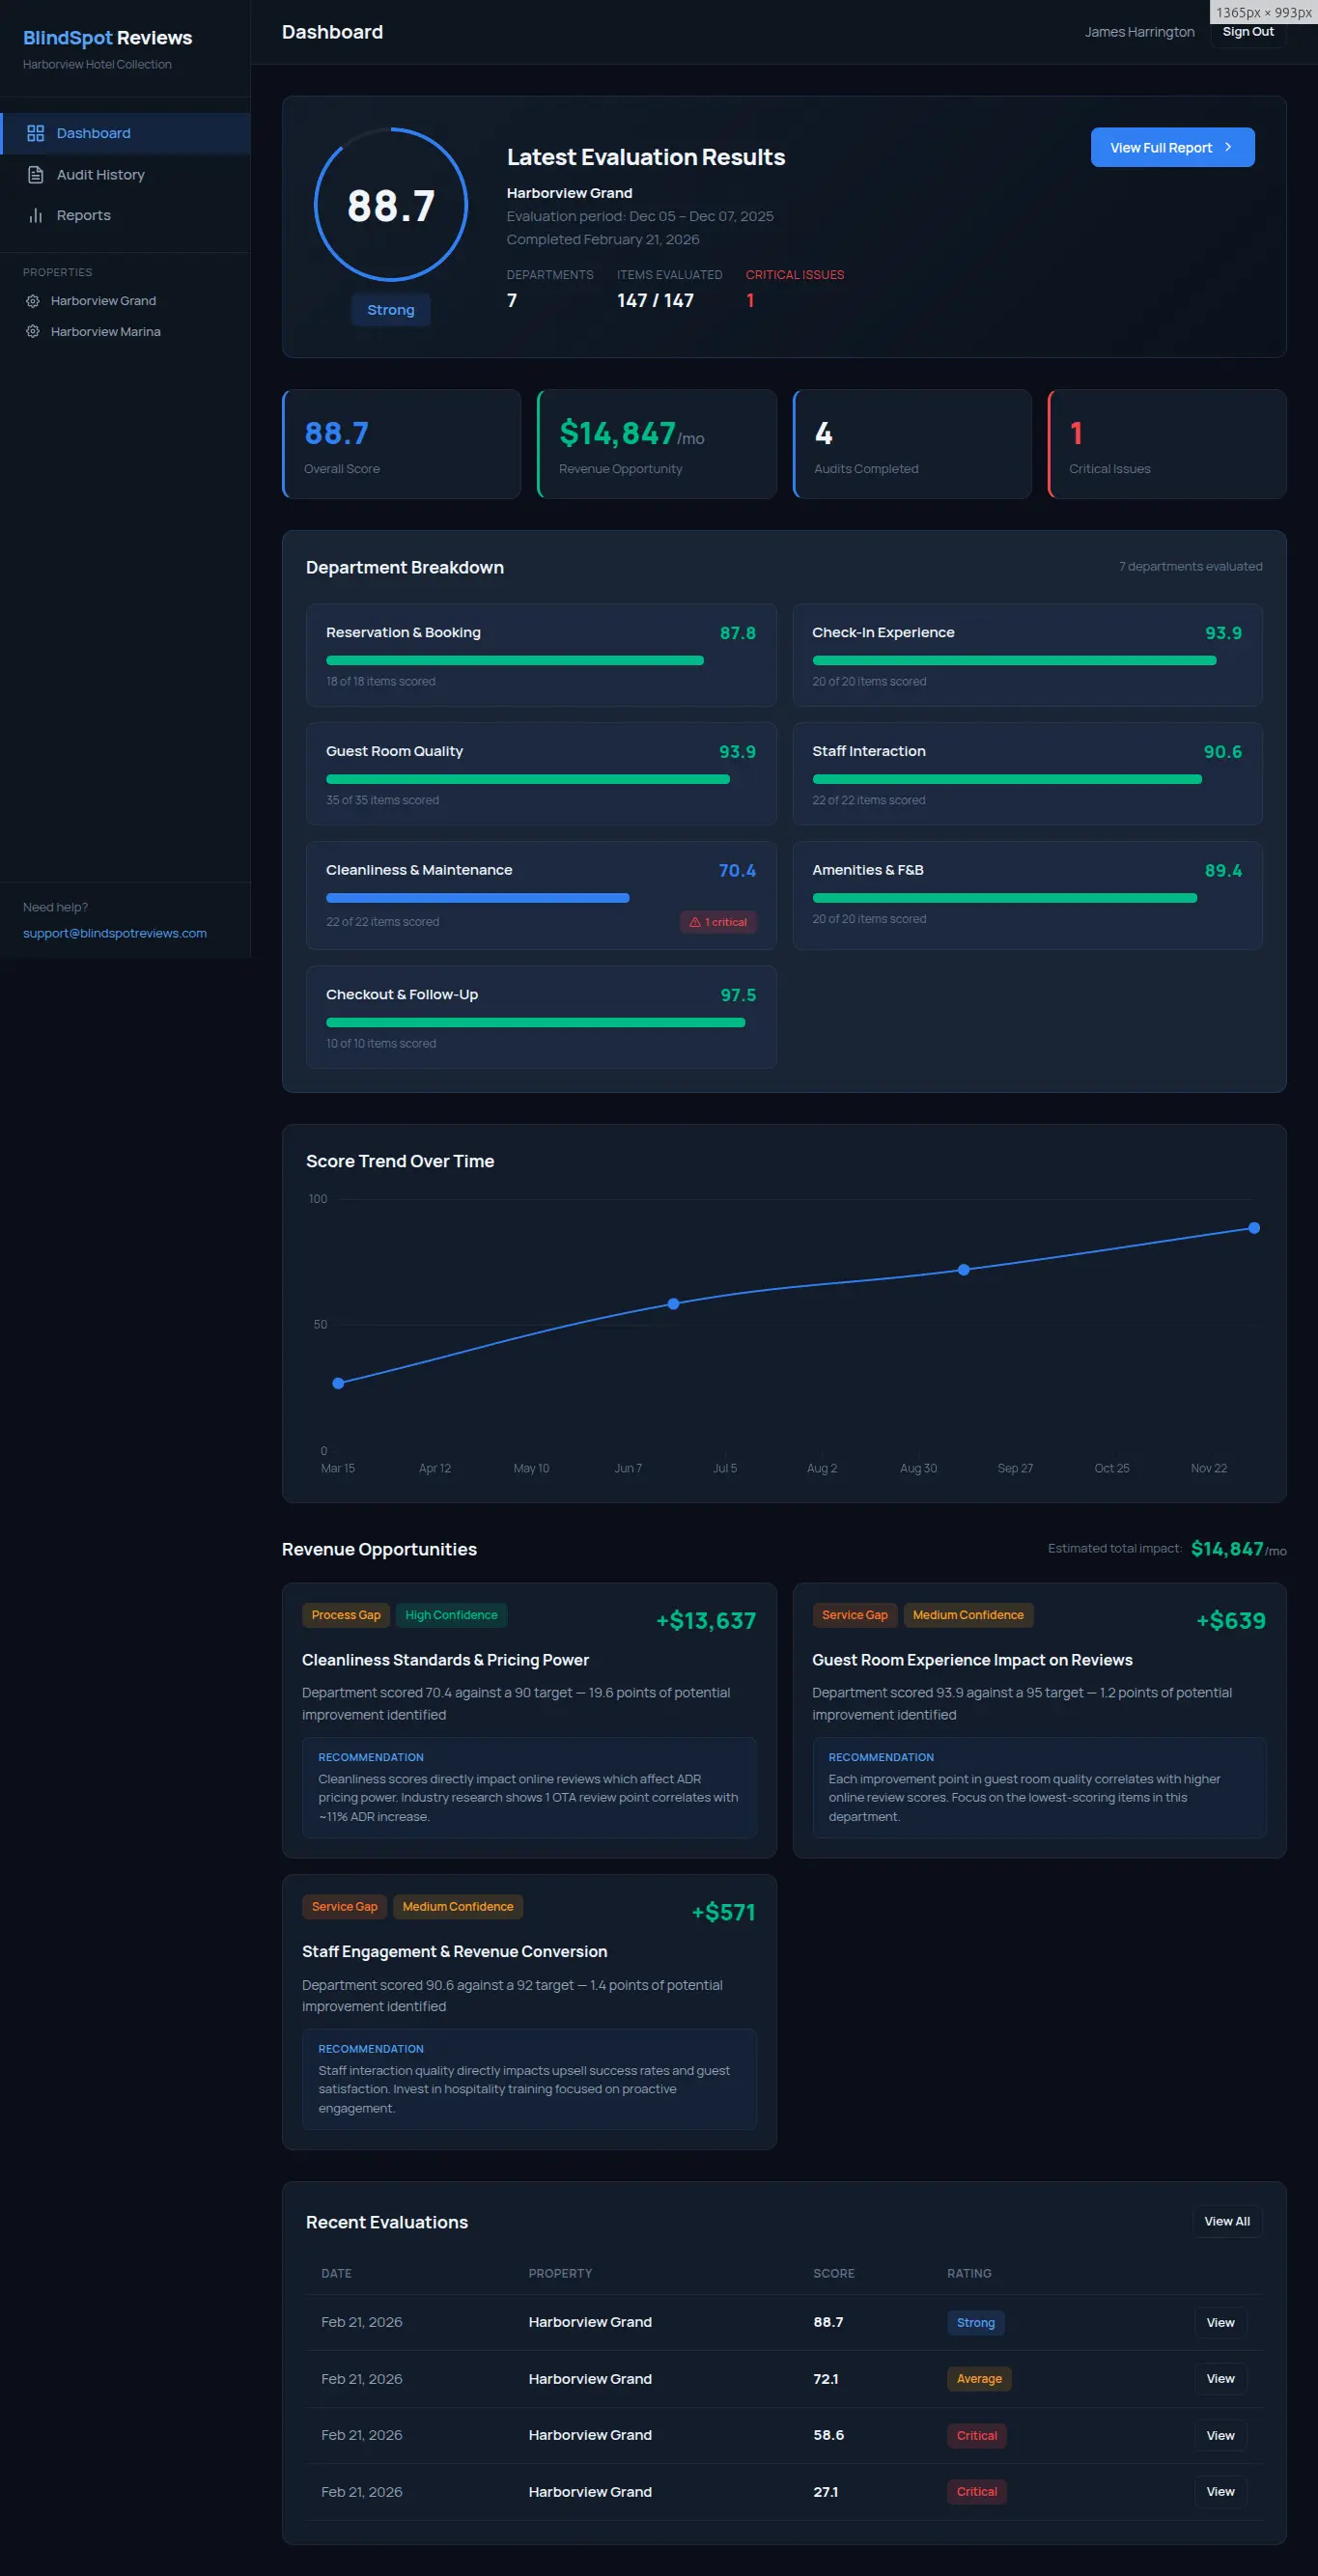
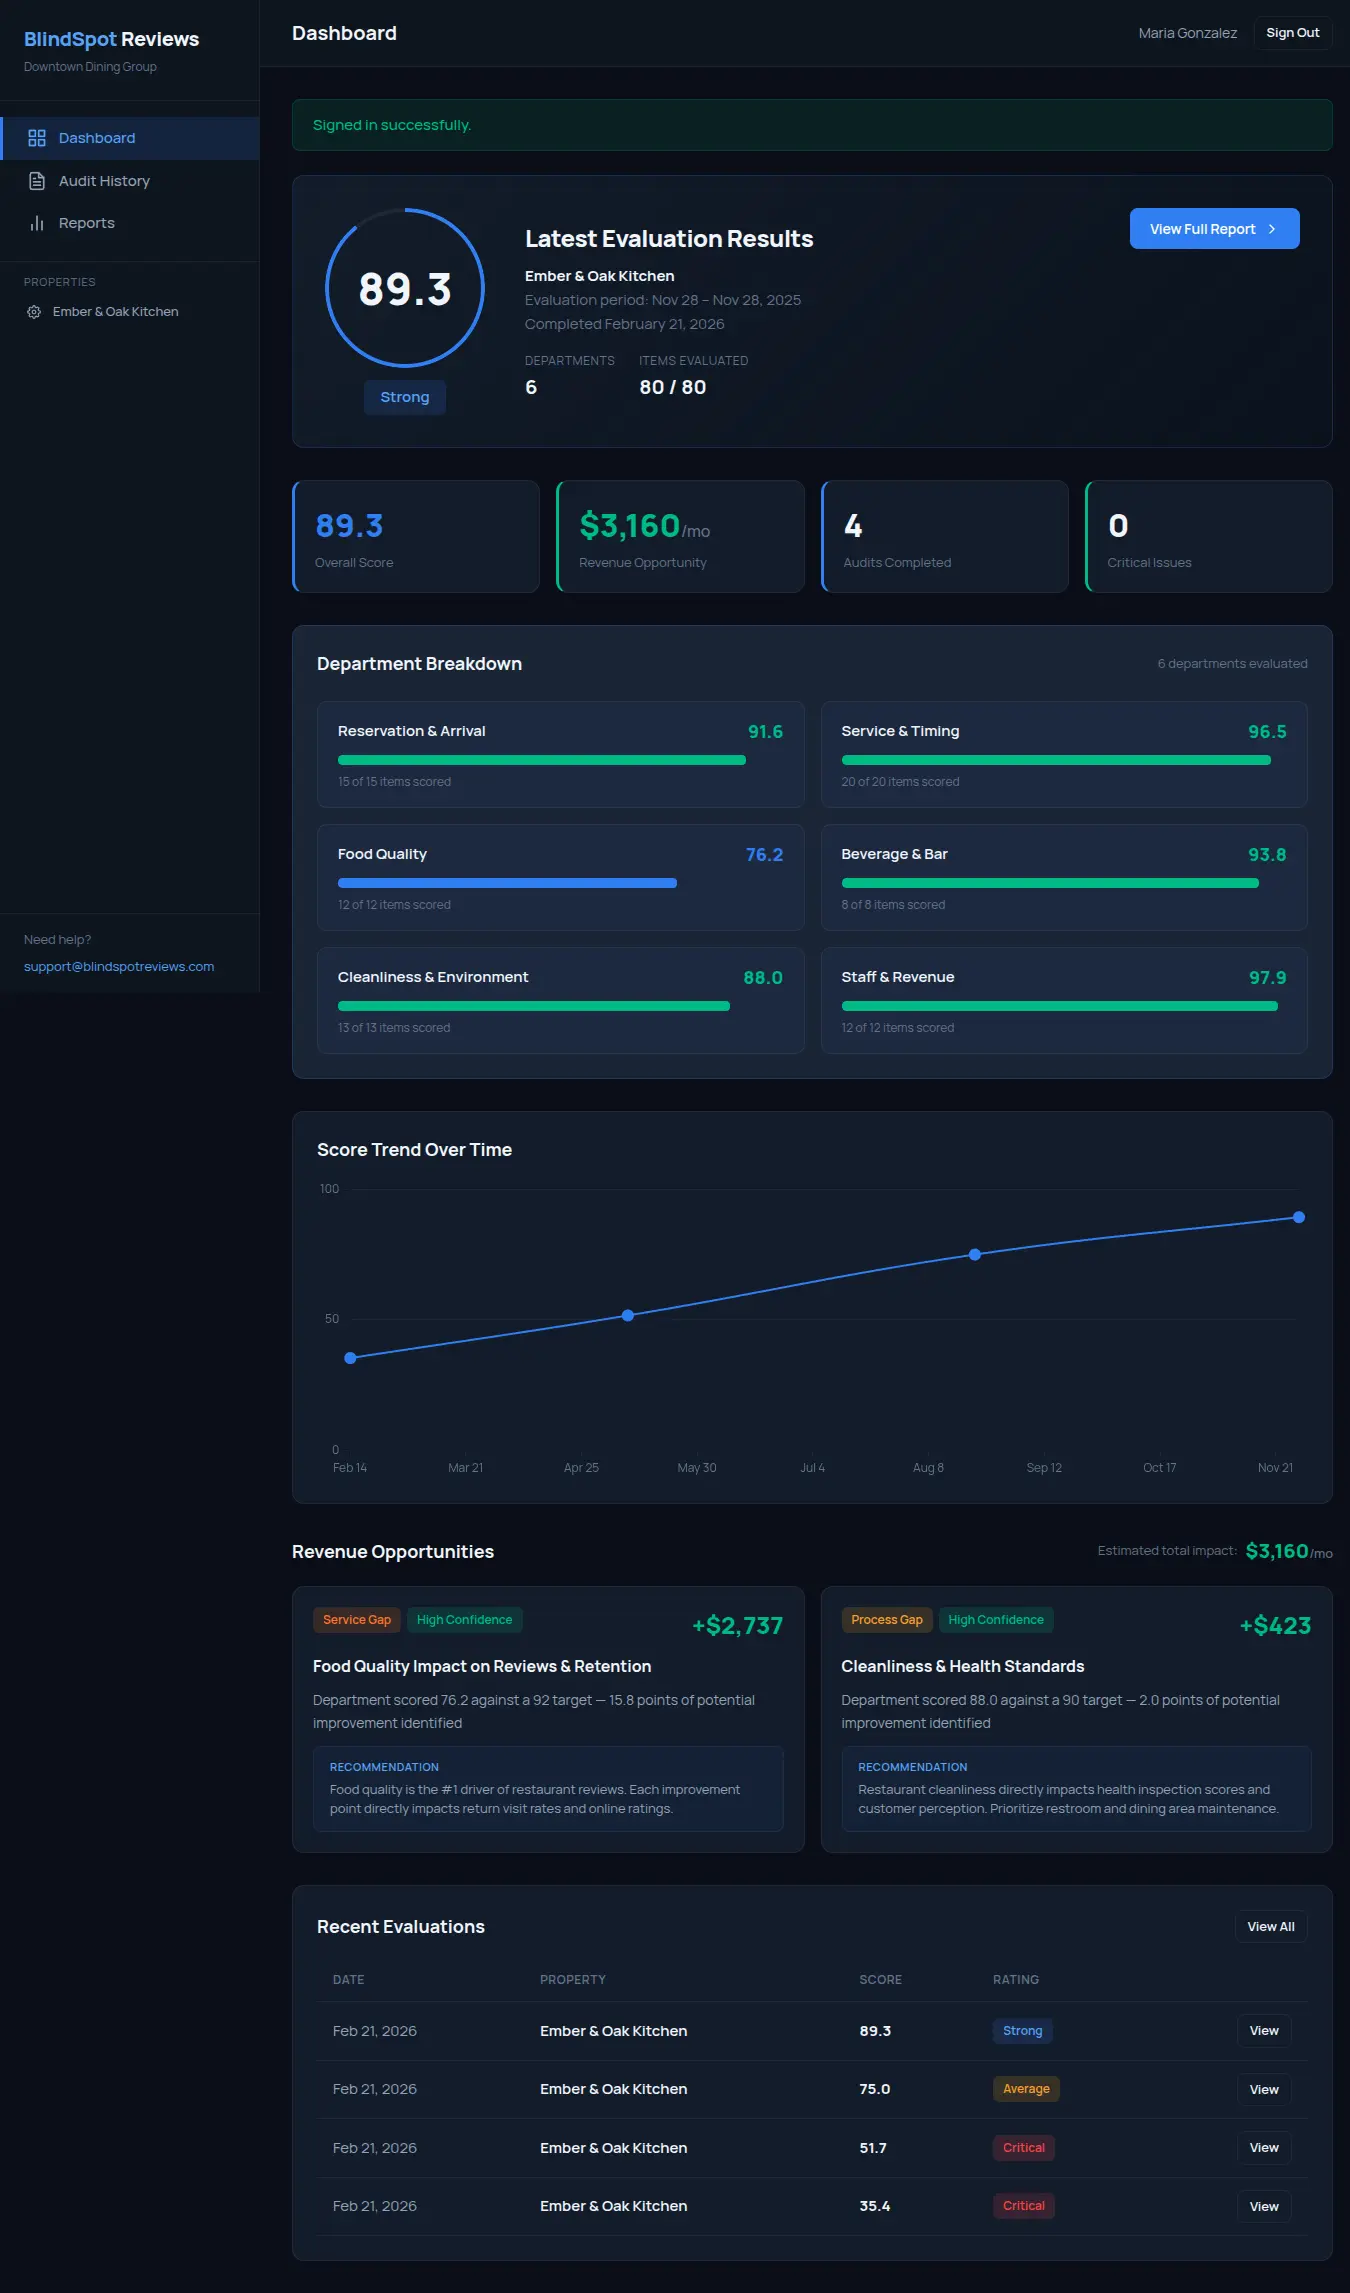
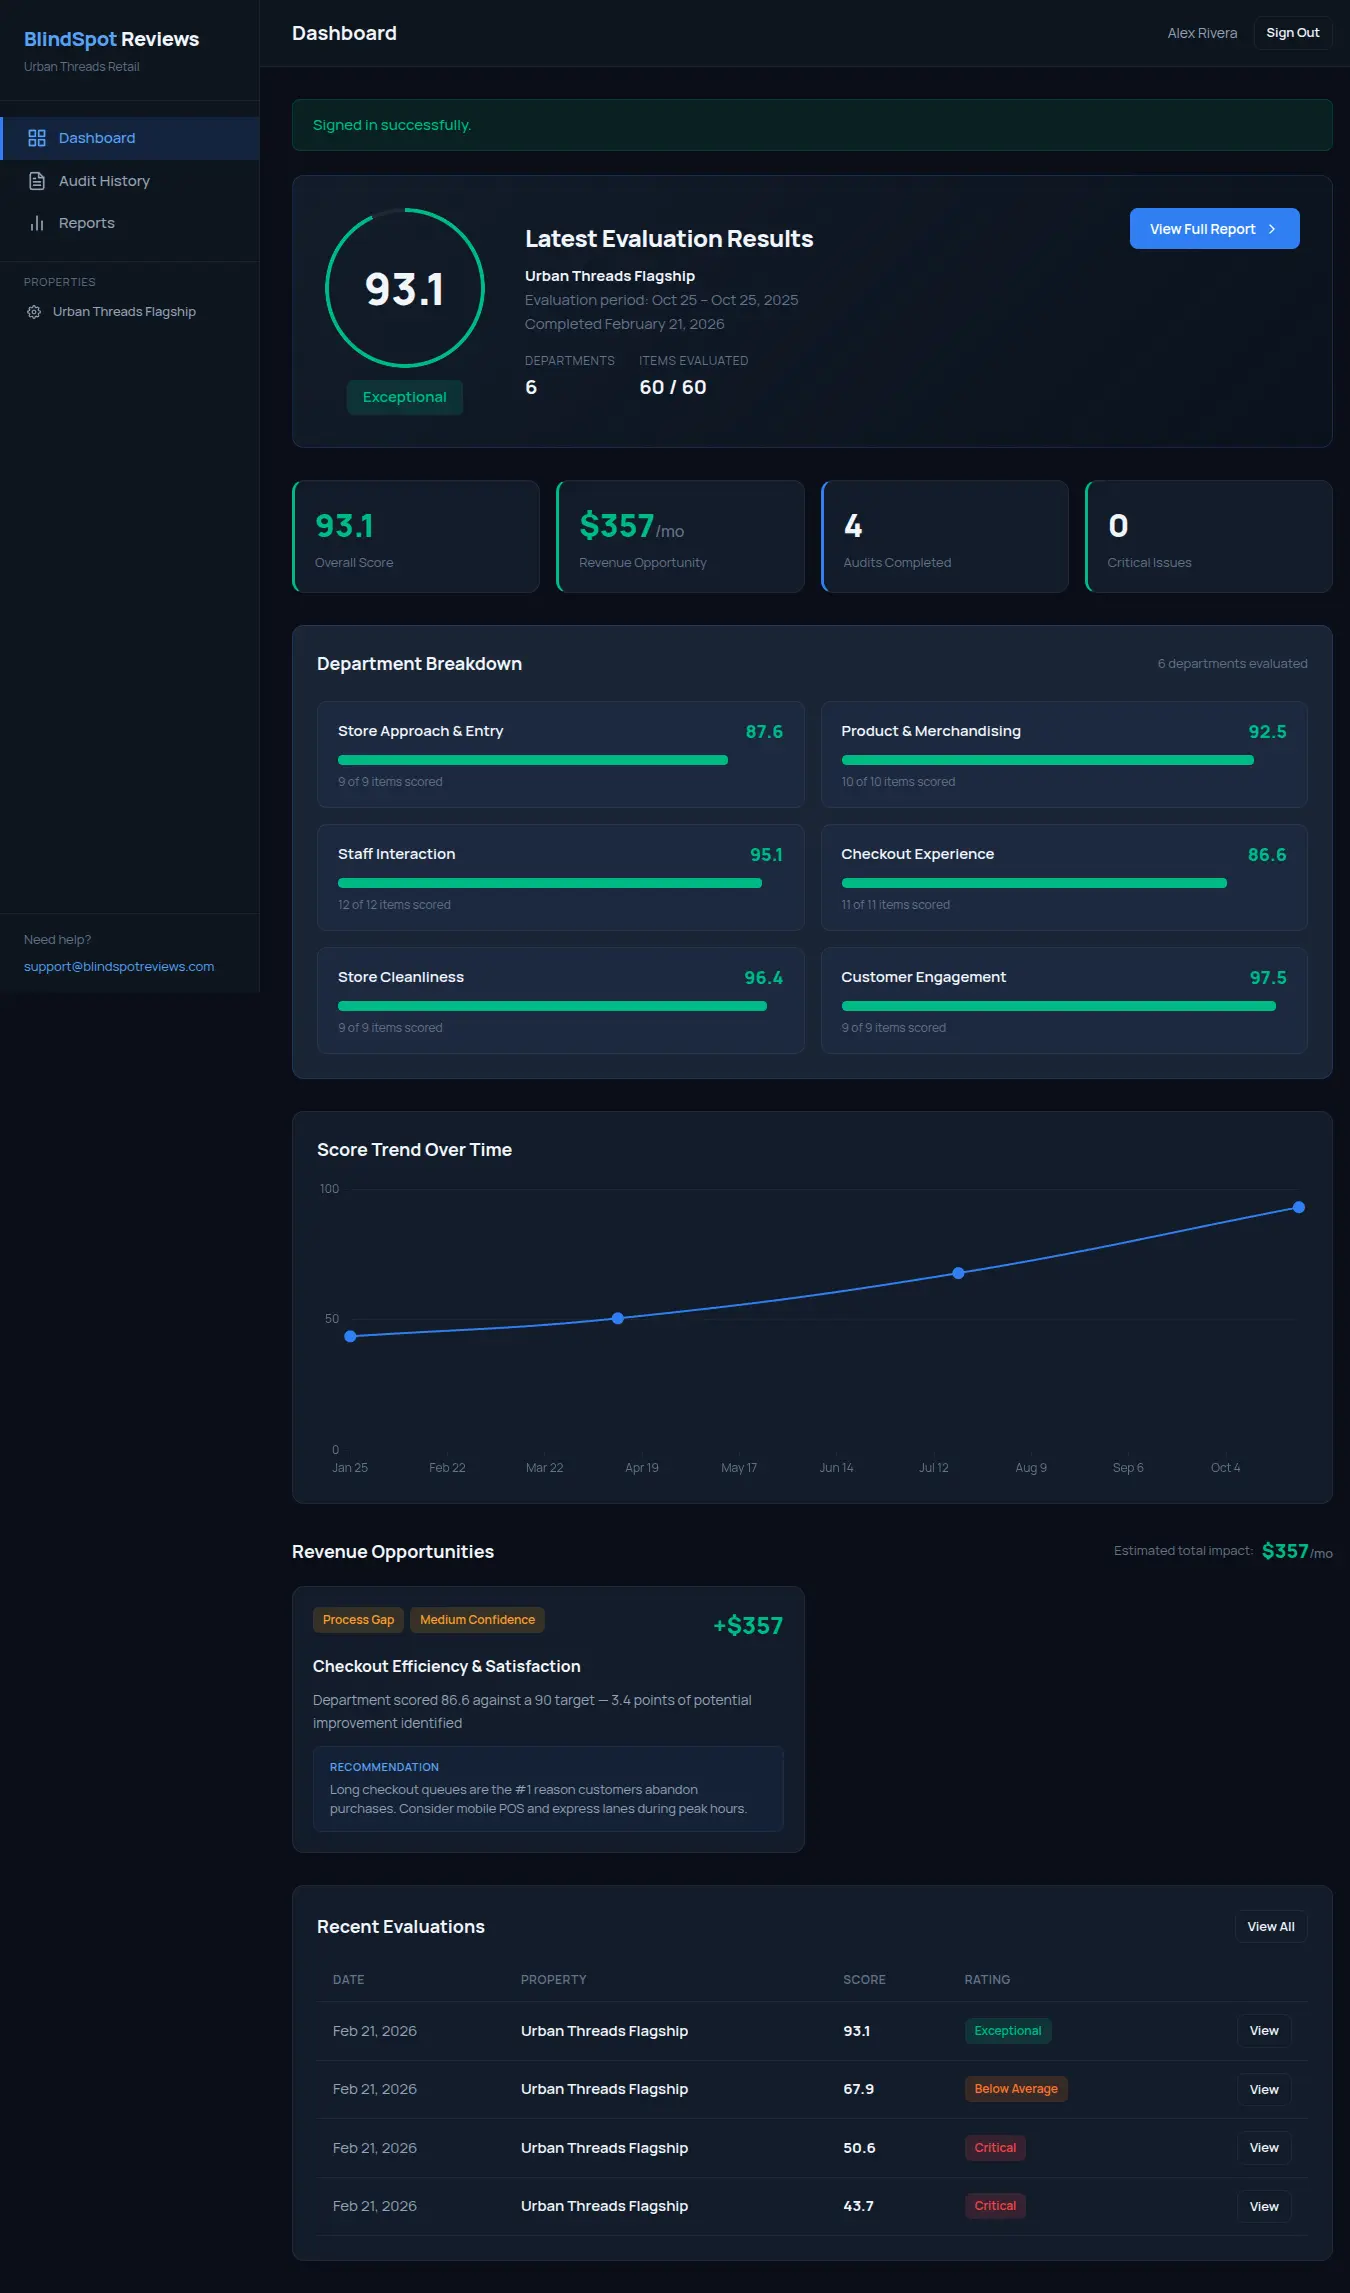
Your private dashboard. Live data.
Scores, department breakdowns, revenue impact estimates, and trend data — updated after every evaluation.
An anonymous evaluation, a scored algorithm, a private dashboard, and a report you can act on the same week.
Log in anytime. See your scores, department breakdowns, revenue impact estimates, and trend data. No PDFs buried in email — live data you can act on.
Every touchpoint scored, weighted, and indexed. Not a subjective opinion — a repeatable evaluation framework that produces comparable results across properties and quarters.
We don't just say "you should upsell more." We calculate how much you're losing. If your front desk converts upgrades at 2% instead of 8%, we show you the dollar gap.
No simulations. No desk research. A trained evaluator visits your business as a real customer — stays the night, dines at your restaurant, shops your store — and documents everything.
25–40 pages. Photo evidence, timestamped observations, department-by-department scoring, and specific training recommendations. Not fluff — operational intelligence.
One audit is a snapshot. Quarterly monitoring shows trajectory. Did the front desk training actually improve check-in scores? The data answers it.
Scores, department breakdowns, revenue impact estimates, and trend data — updated after every evaluation.
Every audit produces a 25–40 page performance report AND populates your private dashboard with scored, trackable data.
Overall score, critical findings, and top revenue opportunities at a glance.
Category-by-category scoring with item-level detail and trend indicators.
Quantified projections based on observed missed opportunities.
Timestamped documentation of maintenance, cleanliness, and signage findings.
Staff scripts, protocols, and process improvements tailored to your business.